US VISA-IMMIGRATION: Record number of naturalized immigrants eligible to vote in 2020
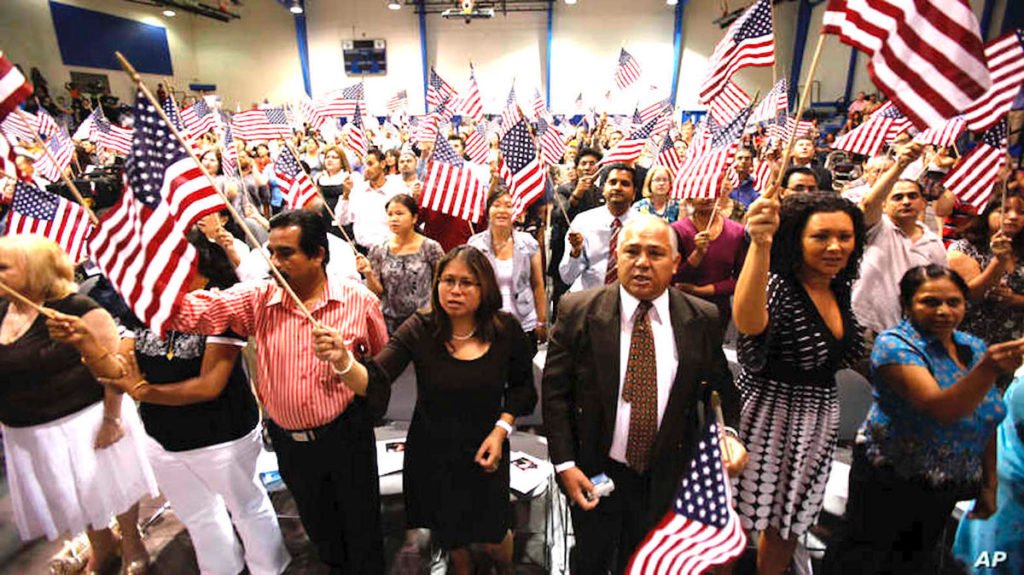
New US citizens being inducted in Arizona. A record number of them will be eligible to vote in the coming presidential election. AP PHOTO
.
.
WASHINGTON — At a time when US immigration policy issues have become controversial, a record number of immigrants are eligible to vote in the presidential election this year, a new report says.
The Pew Research Center report released last Wednesday shows that the size of the immigrant electorate has nearly doubled since 2000. Eligible voters are US citizens aged 18 and older.
Mexican and Filipino immigrants are the largest groups among foreign-born eligible voters, the report says.
More than 23 million naturalized immigrants in the United States are eligible to vote, or about 1 in 10 eligible voters. But they must register to vote and actually show up at the polls to have an impact on the election.
ADS by:
Memento Maxima Digital Marketing

– SPACE RESERVE FOR YOUR ADVERTISEMENT –
Pew’s analysis is based on data from the US Census Bureau’s American Community Survey and the 2000 US decennial census.
“Many of the administration’s proposed policy changes, such as expanding the border wall and limiting immigration have generated strong, strong polarized reactions from the public,” Pew says. “These proposals may also affect how immigrants see their place in America and the potential role they could play in the 2020 presidential election.”
Pew notes that historically, voter turnout rates for immigrant eligible voters has lagged behind US-born voters. In 2016, just 54% of foreign-born eligible voters cast ballots, compared to 62% of US-born eligible voters.
But within the racial and ethnic groups with the largest numbers of immigrants, the trend is different, Pew says.
“Immigrant voter turnout rates have trailed the U.S. born overall,” Pew says, “but not among Latinos and Asians.”
About 53% of Hispanic immigrants who were eligible to vote cast ballots in 2016, compared with 46% of the US born. Similarly, among Asian eligible voters, 52% of immigrants voted, compared with 45% of the US born.
ADS by:
Memento Maxima Digital Marketing
– SPACE RESERVE FOR YOUR ADVERTISEMENT –
Some other findings in the report:
- 46% of the nation’s eligible immigrant voters live in states where Democratic primaries or caucuses take place on or before Super Tuesday. This is up from 21% in 2016, Pew says, a change driven primarily by movements in the calendar of the Democratic Party’s primaries and caucuses.
- The number of immigrants living in the US is rising, but just half of immigrants in the country are eligible to vote
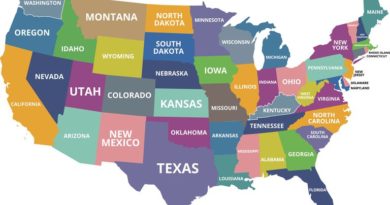
- The four states with the largest eligible voter populations — California, New York, Florida and Texas — are also home to most immigrant voters. “Even so,” Pew says, “immigrant eligible voters are dispersed across the nation. While California may have more immigrant voters than any other state, many states have substantial immigrant eligible voter populations.”
- The immigrant electorate is growing the fastest in Georgia, Minnesota and North Carolina. “All three have seen their numbers of immigrant eligible voters nearly triple between 2000 and 2018,” Pew says. “Georgia increased by 193% during this time, the nation’s fastest growth.”
ADS by:
Memento Maxima Digital Marketing
.
– SPACE RESERVE FOR YOUR ADVERTISEMENT –